数据网格:软件工程师的去中心化数据分析
Data Mesh: Decentralized Data Analytics for Software Engineers
原文地址
Kimi 总结归纳
数据网格是一种新兴的数据架构方法,它为软件工程师提供了一种新的、去中心化的方式来进行数据分析。这种方法的核心在于将数据分析的责任和能力下放到更接近业务和用户行为数据的领域团队。通过这种方式,数据网格使组织能够更快速地做出基于数据的决策,并促进了数据驱动的创新。
数据网格的关键原则
- 领域所有权:领域团队负责管理和分析与他们领域相关的数据。这种所有权模式确保了数据在有界上下文中的清晰定义和最佳理解。
- 数据即产品:数据被视为产品,领域团队负责将数据清洗、转换并提供给其他团队使用。这要求数据具有高质量、易于访问和理解的特性。
- 自助服务平台:领域团队可以使用自助服务平台来获取、清洗和分析数据,而不需要依赖中央数据团队。这种平台提供了必要的工具和接口,使领域团队能够独立地进行数据分析。
- 联邦治理:在数据网格中,治理是跨领域的协作过程。领域团队共同定义和遵守全局政策,以确保数据的互操作性、安全性和合规性。
数据网格对软件工程师的意义
- 提高数据可访问性:软件工程师可以直接访问与他们的领域相关的数据,而不需要通过中央数据团队。这大大提高了数据处理的速度和效率。
- 增强数据质量:由于领域团队最了解自己的数据,他们可以更有效地清洗和维护数据,从而提高数据质量。
- 促进跨领域合作:数据网格鼓励领域团队之间的协作,共享数据和见解,从而推动整个组织的创新和增长。
- 提升决策质量:软件工程师可以利用领域数据进行更深入的分析,从而做出更明智的技术和业务决策。
实施数据网格的挑战
- 文化和组织变革:数据网格要求组织文化和结构进行相应的调整,以支持去中心化的数据管理和协作。
- 技术和工具的选择:领域团队需要选择合适的技术和工具来管理和分析数据,这可能需要额外的培训和支持。
- 数据安全和隐私:在去中心化的数据环境中,确保数据安全和隐私的挑战更大,需要制定严格的安全策略和控制措施。
通过实施数据网格架构,软件工程师可以更好地利用数据资源,提高业务效率和竞争力。同时,也需要认识到这一转变带来的挑战,并采取相应的措施来克服。
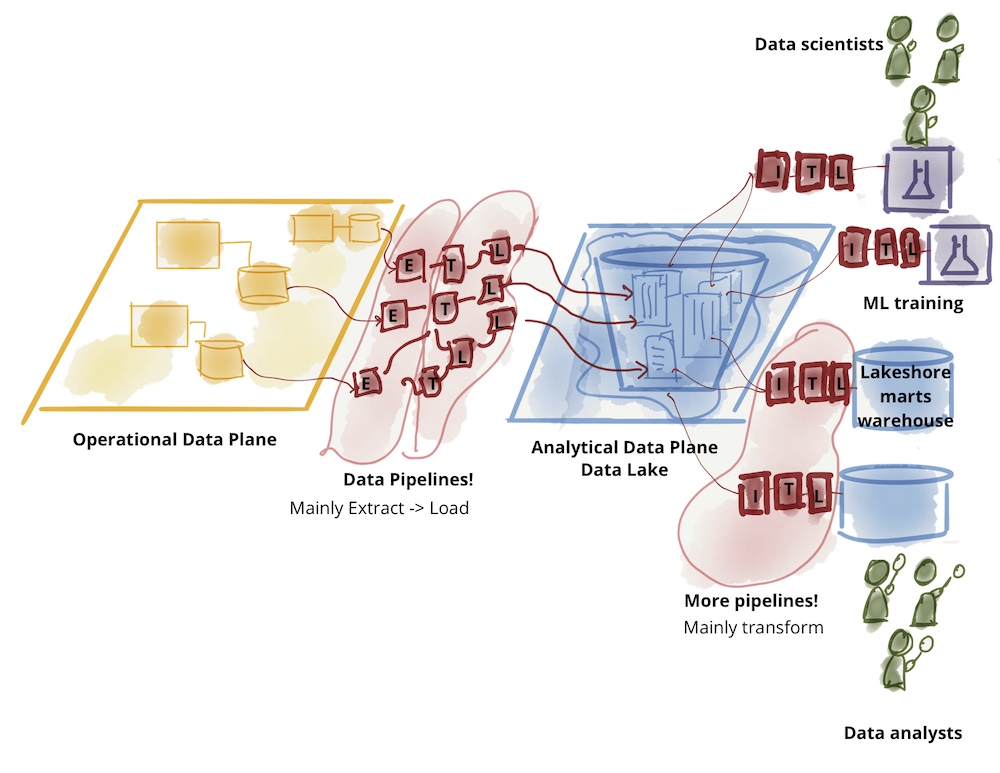
运营IT系统的数据中包含有价值的信息。这些信息可以让我们推断用户行为,并帮助我们更好地理解软件系统。然而,软件开发人员经常在他们的项目中忽视数据分析。对于许多项目经理和产品所有者来说,数据在评估特性和用户故事时处于次要地位,主要是因为数据很少以分析准备好的形式提供。
传统上,数据由数据团队在数据仓库系统和数据湖中收集和分析。然而,在评估这些数据时,重点通常在于企业管理和营销,而不是开发新特性的团队。此外,这些评估的结果通常令人失望。这往往是由于连接的源系统中数据质量不足,以及由中央组织的数据团队缺乏解释这些数据的专业知识。此外,这样的集中式系统和团队在不断增长的数据分析需求面前无法快速扩展。
数据网格是一种相对较新的、去中心化的数据架构方法,旨在使开发团队能够独立地进行跨领域数据分析,以更好地理解他们的用户和系统的行为。通过向其他团队提供精选数据,创建了一个有价值的去中心化数据网络。
数据架构中的模块化
近年来,软件开发取得了重大进展。战略性领域驱动设计(DDD)有助于组织和描述系统中的技术功能。可以通过上下文映射等方式确定各个领域的明确责任,并识别和描述社会技术关系和接口。
组织结构中的自治产品团队负责一个明确的领域,并作为回报,他们拥有高度的自由度,从编程语言的选择到团队人员配置。因此,这些团队构建的软件系统反映了他们有界上下文的技术范围。为此,他们使用模块化软件架构方法,如微服务(按照Sam Newman在2015年已经制定的意义)或自包含系统,以避免单体系统,并最好地实现可靠性和可维护性等质量目标。与其他领域的交互通过明确定义的接口进行,尽可能异步作为领域事件,例如通过Apache Kafka或HTTP feed。
根据数据网格原则,现在也可以将单体结构拆分为单独的技术领域。前提是基于领域边界对团队进行划分。而不是由数据团队管理的中央数据仓库汇集所有数据,领域团队为自己的特定领域进行分析评估,并通过明确定义的接口访问其他领域的数据集。
数据网格的原则
“数据网格”一词由Zhamak Dehghani在2019年的文章“如何从单体数据湖走向分布式数据网格”中创造。定义通常包括以下四个原则:
- 领域所有权
- 数据即产品
- 自助服务平台
- 联邦治理
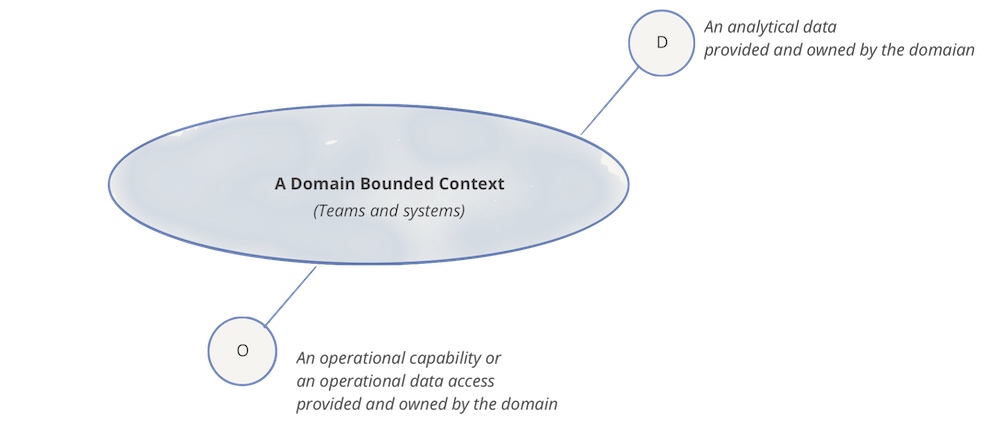
领域所有权意味着负责操作系统的团队也提供他们的分析数据。这背后的核心思想是,数据只有在其有界的上下文中才有明确的定义,各自团队最了解自己的数据。因此,每个团队独立决定哪些数据重要以及如何为分析目的准备它们。每个团队对其数据负全部责任。

数据即产品的原则是,分析相关的数据应该以便于其他团队轻松访问的方式进行管理和存储。数据在团队内经过通常的开发过程,从产品所有者描述用户故事和关于数据访问和各个字段重要性的可理解文档,到包括监控在内的运营责任。凭借其数据,团队为其他团队提供了宝贵的贡献。
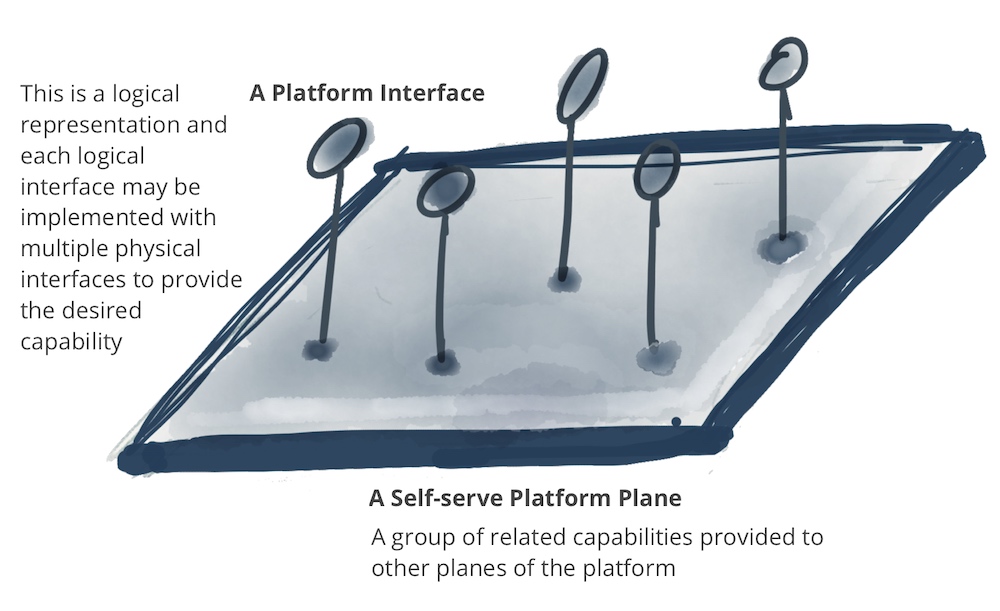
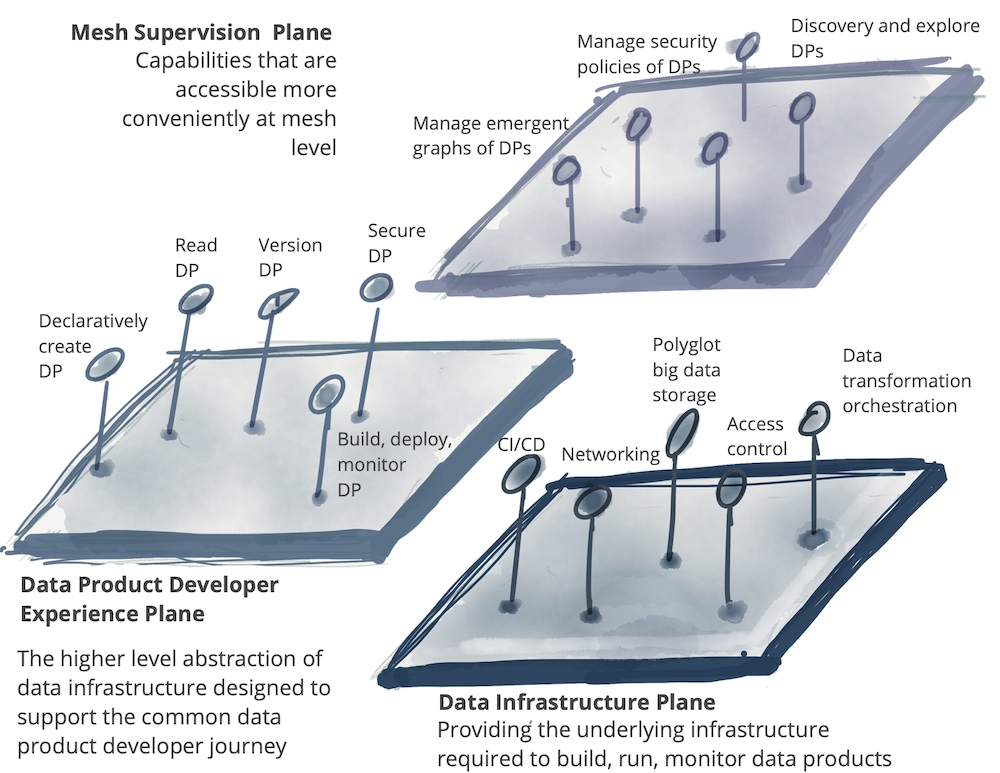
自助服务平台描述了一个数据平台,团队用它来提供分析数据、数据评估和可视化,以及轻松访问其他领域的数据。重点是自助服务特性:所有活动都应该在不需要另一个团队介入的情况下进行。
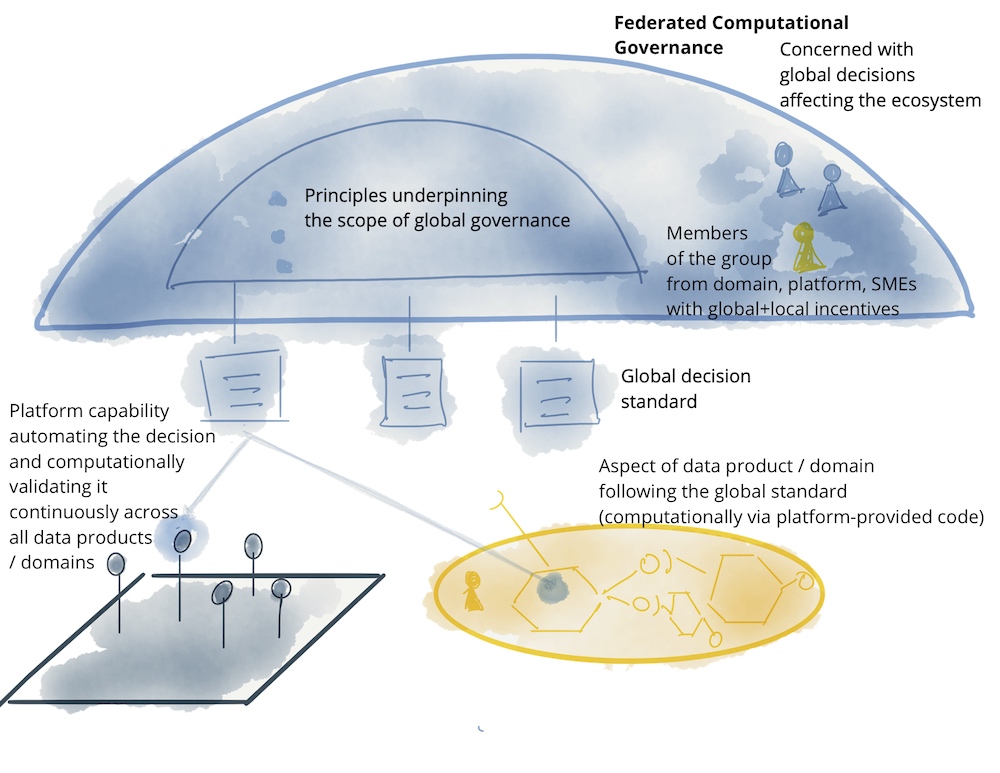
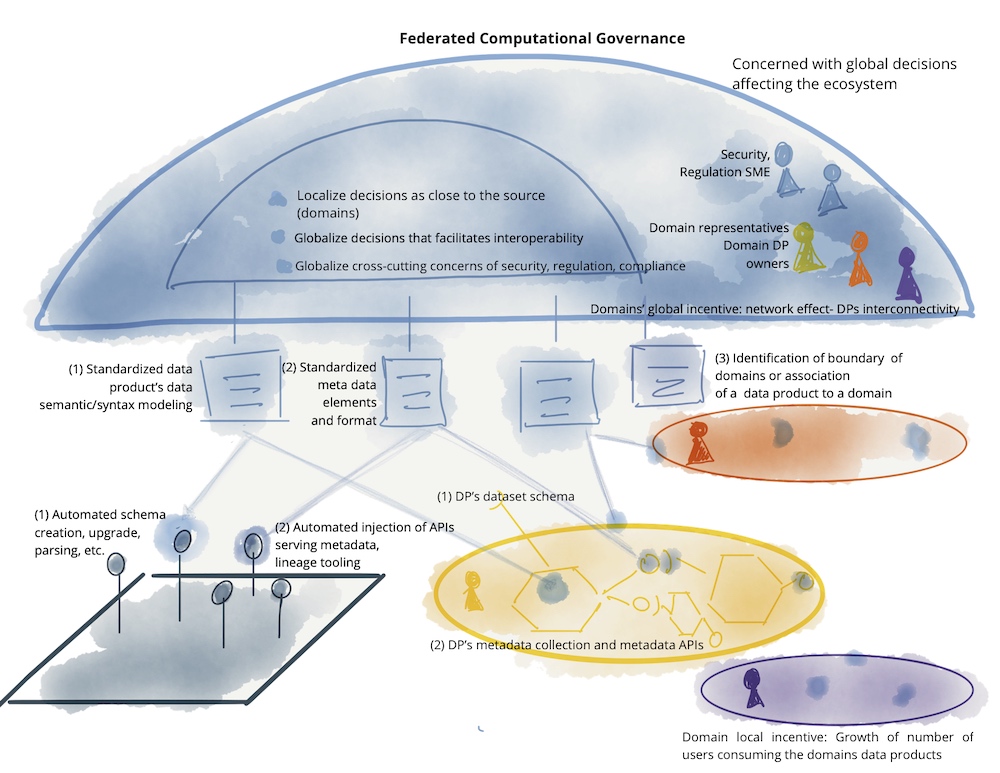
联邦治理指的是跨领域的协议,它规定了如何设计有效的交互以及如何长期保证数据领域的质量。为此,领域的代表共同定义了必要的全局策略(比较宏观架构指南),这些策略对于互操作性和安全性至关重要。在更高层次的扩展中,平台也可以自动确保遵守这些规则。
这些原则适用于描述去中心化数据架构中的责任。但对于领域团队中的软件开发人员来说,它们意味着什么呢?
面向整体结果的领域特定数据分析
首先,领域团队特别关注的是自助服务平台。到目前为止,操作系统的开发者通常不进行数据分析,因为它们通常不能在操作数据库上高效执行,并且会影响生产应用的性能。然而,现在提供了一个易于使用的数据平台,使团队能够独立地准备数据进行分析。

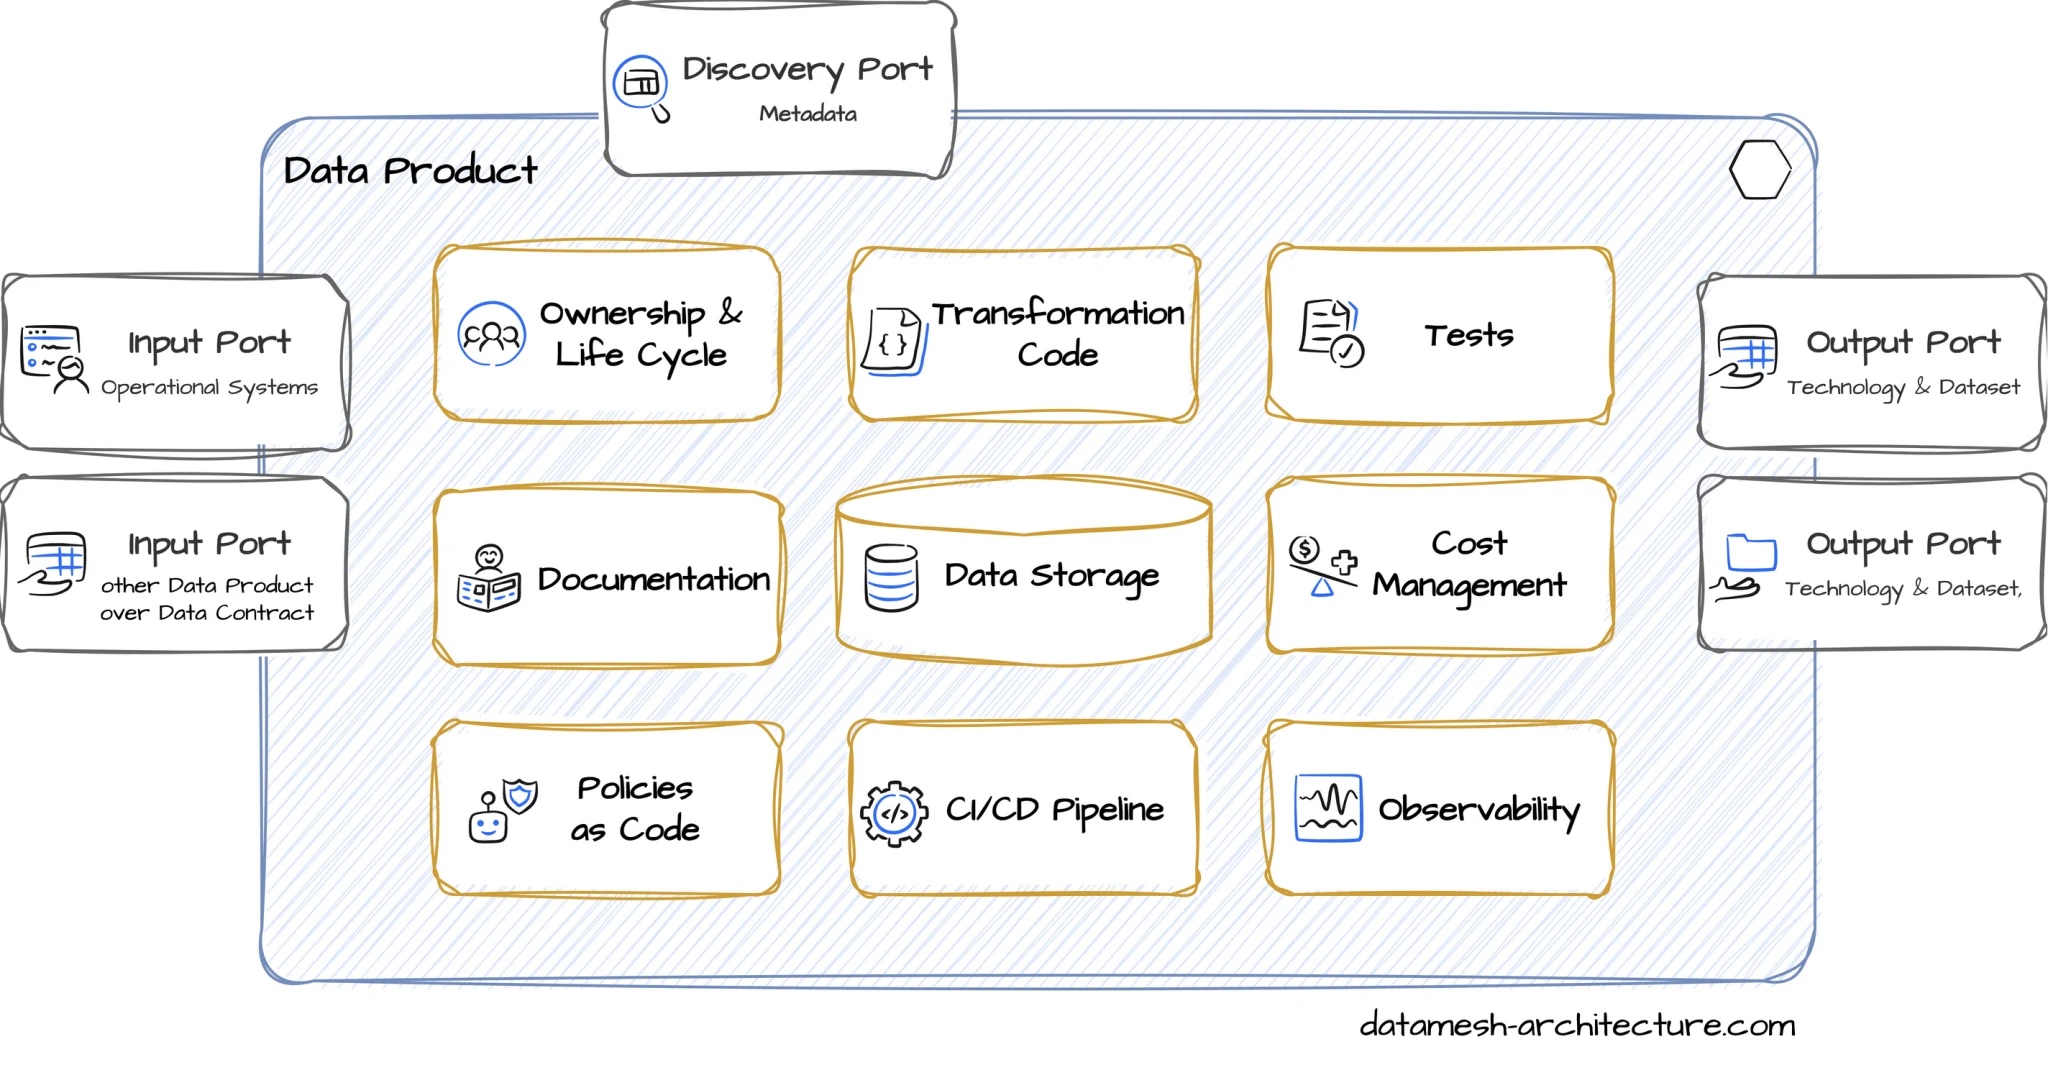
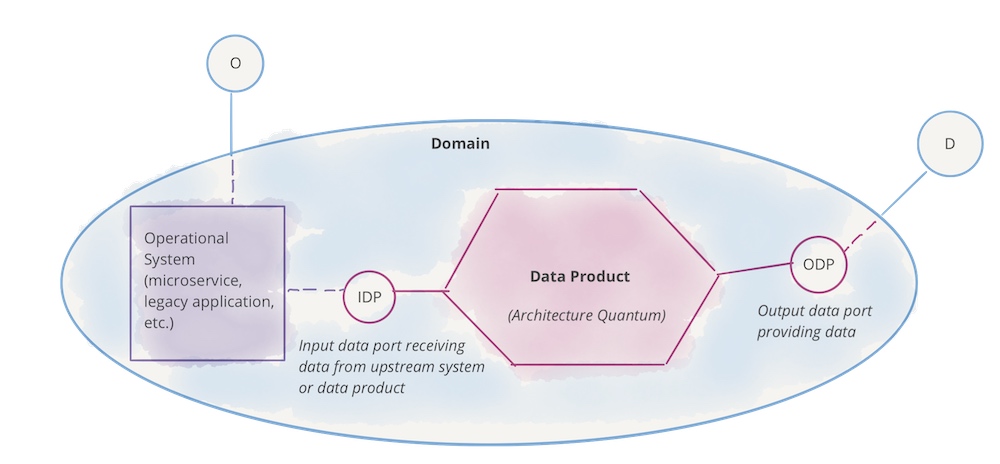
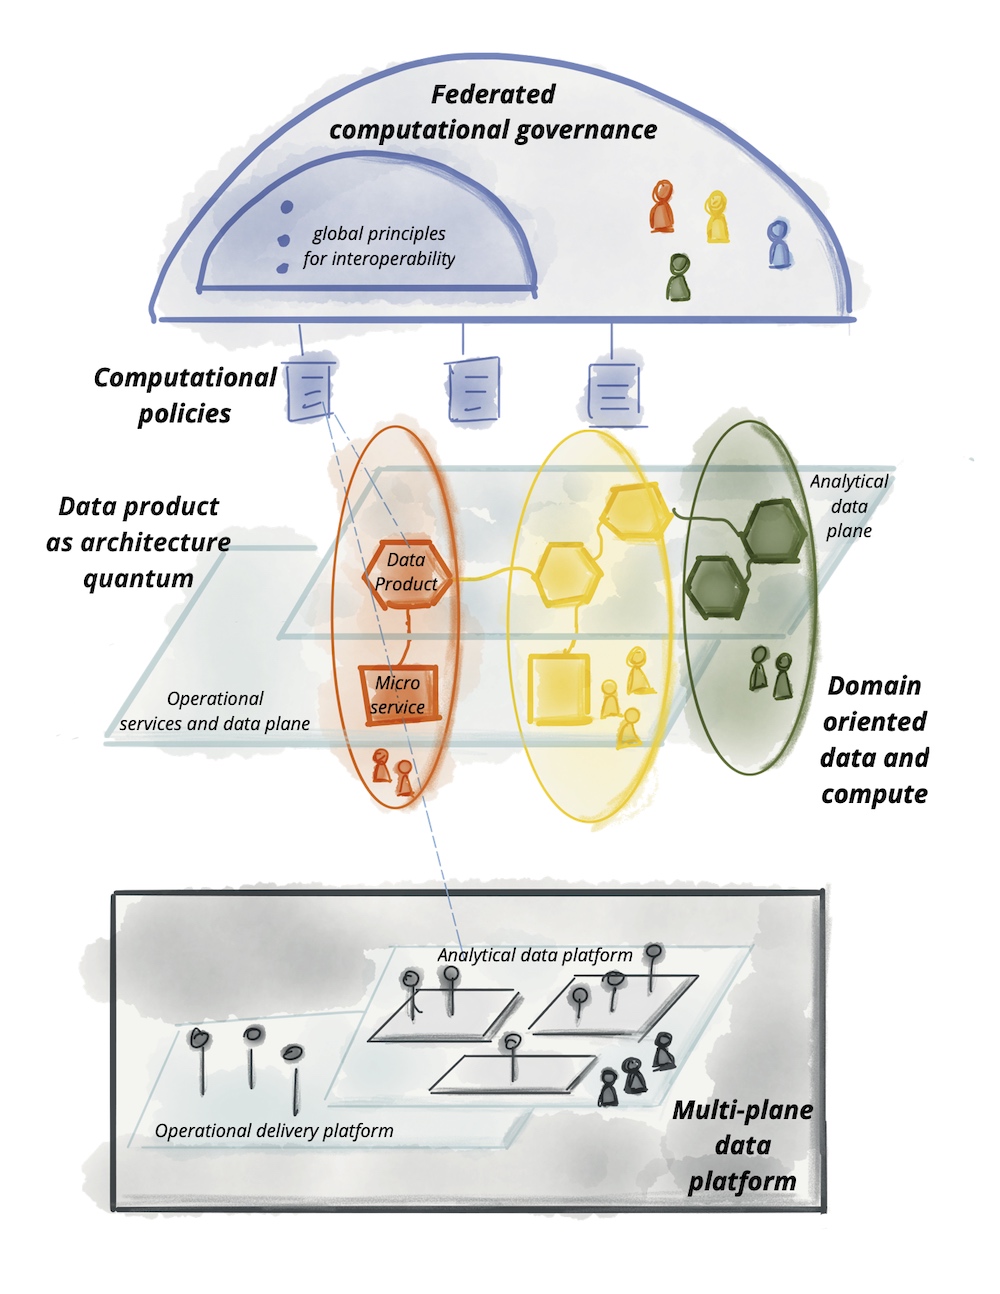
数据网格架构(图2)。
数据网格架构(图2)。
数据平台通常由专门的数据平台团队管理,包括存储、数据摄取、处理、分析、可视化以及元数据和权限的管理。使用数据目录来定位和记录数据产品——通常是数据、AI模型和结果展示的组合——并遵守约定的指导方针。
通过所描述的数据平台,团队现在能够为分析目的提供数据。一旦数据被传输到平台上,它们仍然需要被准备和清洗。为此,建议首先将数据以源格式(例如JSON)导入到CLOB(字符大对象)字段中,这样数据库模式就不必考虑。接下来,开发人员应将数据转换为结构化的SQL表格式,去重,并在必要时缓解结构变化和空值。鉴于数据保护要求,他们还应尽早删除或至少匿名敏感信息(个人数据、信用卡信息),最好在将其存储在平台之前。这种清洗可以由了解自己运营数据的领域团队比缺乏技术上下文的中央数据团队更有效地完成。这种有针对性的数据准备有助于提高数据质量。
有了清洗后的数据,团队可以自己进行分析。最初,这些通常是简单的SQL查询。使用JOIN操作,可以合并和整合来自不同源系统(例如不同的微服务)的数据记录,并使用聚合函数。窗口函数对于执行分区的多行评估特别有帮助。可视化有助于识别趋势和异常。领域团队可以使用自己的数据来解释过去的系统性能并跟踪用户行为。当涉及到从发现中推导新特性并早期评估用户故事的好处时,这特别有帮助,而不是仅仅基于直觉进行优先级排序。识别系统错误也更容易,例如总是在特定事件发生后不久发生的那些错误。有了数据网格,领域团队可以独立进行评估,并将洞察力更快地纳入运营改进。
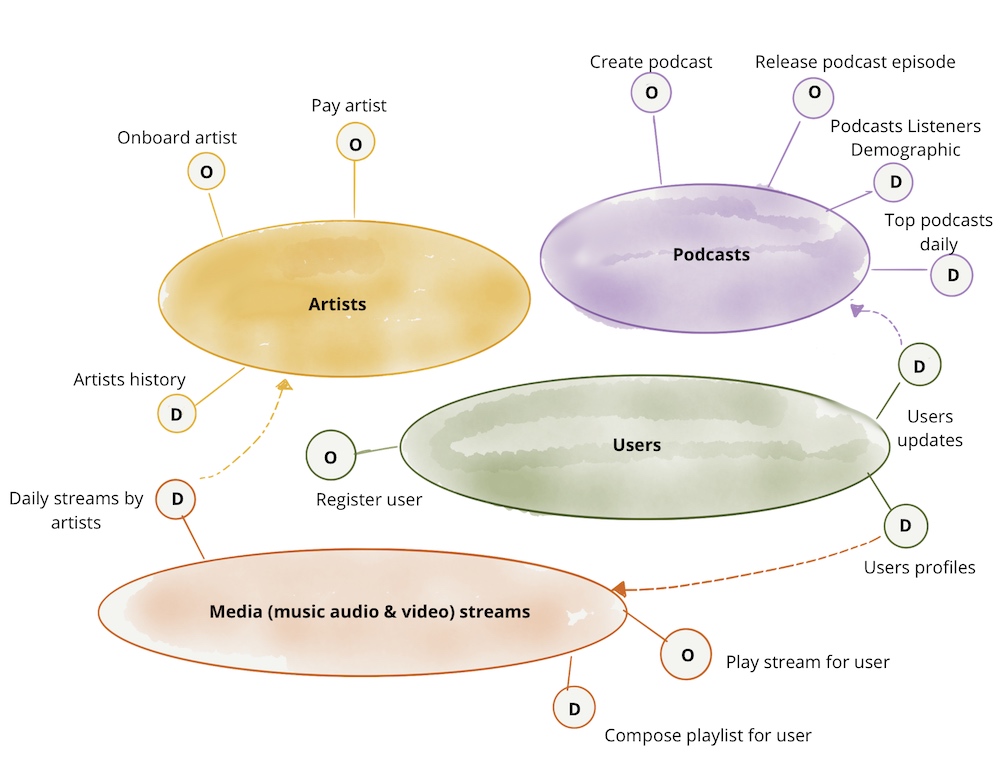
仍然缺少的是对整体结果的概述,例如网页商店首页UI更改对后续购买的影响。另一个电子商务的例子可能与转化率有关。衡量实际购买的数量是有趣的,但最初被忽视的问题是,客户是否退回了订购的商品。这是不同领域数据联网的地方:如果购买完成领域将一次会话的结果和产品退货领域将退回的物品作为数据记录在平台上可用,相关性——甚至使用A/B测试等有意义的因果关系——可以立即被识别。这种方法符合数据网格的数据即产品原则。一个领域以可访问和有文档记录的形式提供某些相关的数据集。因此,跨领域数据的使用和链接导致越来越有意义的分析。
然而,在跨领域链接数据时,会出现一个问题,即一个领域的数据和术语仅在其有界上下文中有效。这是领域驱动设计中的上下文映射方法有助于描述领域模型之间的关系的地方。例如,遵循开放主机服务模式的数据集必须比作为双边客户/供应商协议结果创建的数据集描述得更精确。
共同协议有助于确保技术和语义互操作性,例如通过所有相关方同意格式(SQL、JSON等)、语言(德语、英语等)以及领域密钥的名称和形式。领域团队和平台团队的代表共同达成必要的协议,并将它们记录为全局策略。

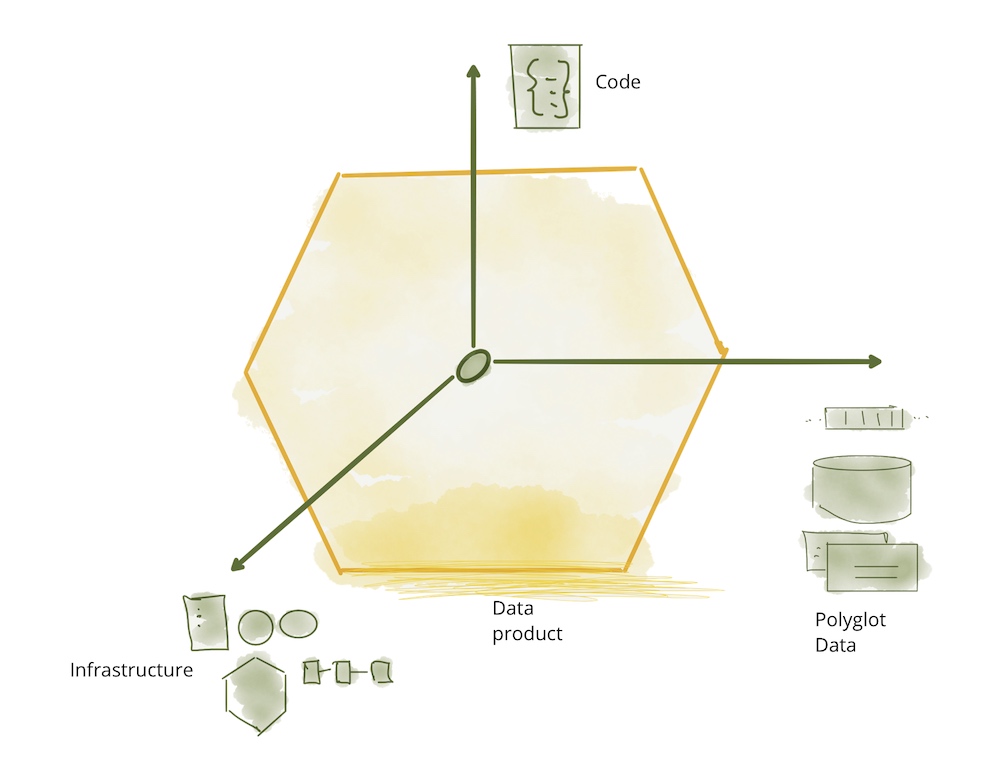
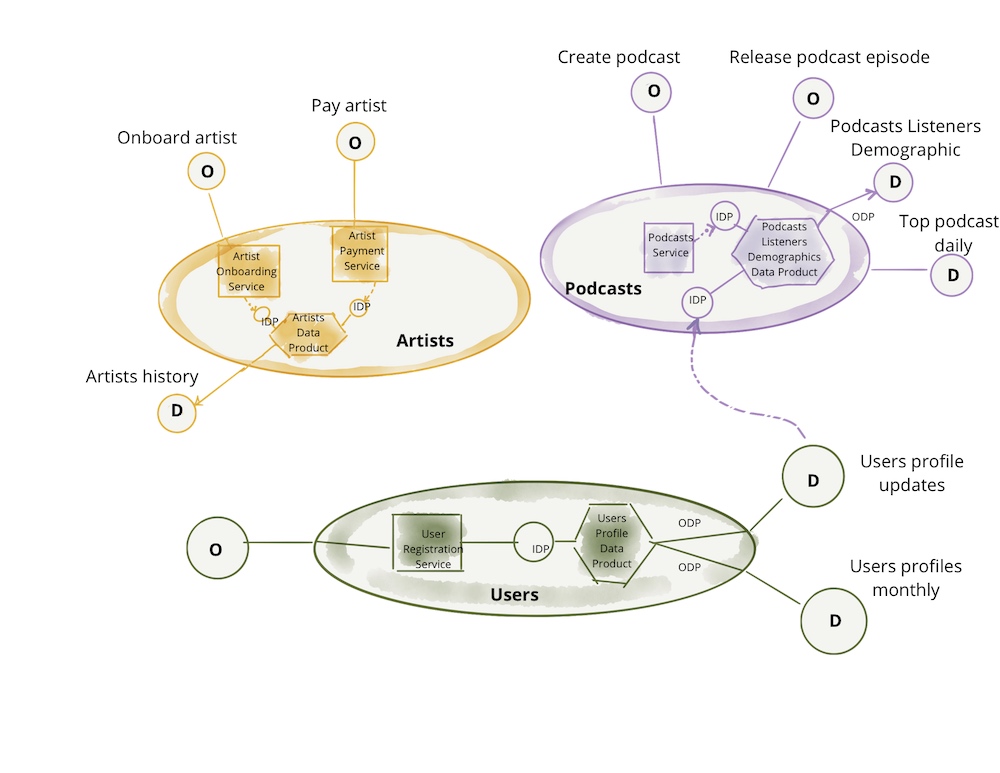
数据产品除了实际的数据集外,还包括元数据。像API一样,数据产品也持续进行监控(图3)。
数据即产品更进一步:如果一个数据集对其他团队可用,它可以与生产API进行比较。因此,团队还必须持续确保数据的可用性和质量。所有数据集都必须有清晰的文档并可查找。然而,现在对数据模型的更改要困难得多。需要监控,以监督数据的可用性、质量和完整性。分析数据因此加入了一个领域的接口——类似于UI和API。
产品所有者负责确保从领域和商业角度来看,数据的提供仍然具有经济可行性。由于通常不将所有领域数据作为数据产品提供给其他团队并不是有效的(即使使用数据的团队可能希望这样做),必须做出明确的决定:哪些内部数据仅用于内部分析目的,哪些应该作为数据产品提供给其他团队?例如,经常引用的领域事件和主数据通常也应该提供给其他领域团队。如果有疑虑,团队必须相互协商并就所需的数据产品达成一致。
实践中的数据网格
数据网格最适合作为自下而上的方法,但如何实际实施呢?理想情况下,它是由一个或(最好)多个表示对数据分析感兴趣的团队开始的。他们就一个数据平台达成一致——如今常见的云服务,如Google BigQuery、AWS S3、Azure Synapse Analytics或Snowflake。然而,为了入门,一个PostgreSQL数据库结合像Metabase或Redash这样的可视化工具也足够了。每个团队在其自己的区域(项目/账户/工作区等)中独立创建资源,如数据库和表格。逻辑结构定义了应该位于不同类型分析数据的区域(见图4)。
数据网格中逻辑信息架构的示例(图4
)
接下来,团队将运营系统的数据输入到数据平台中。这些数据通常以原始形式杂乱无章地出现在一个原始区域。可以使用Kafka Connect等集成进行此操作,或者团队实现自己的消费者调用各自平台的流式摄取API。通常,领域事件(如果有的话)非常适合作为主要的分析数据基础,因为它们代表业务流程的事实。另一方面,应尽可能避免使用ETL批次导出数据库,以便实现实时分析,而不暴露操作数据库模式。
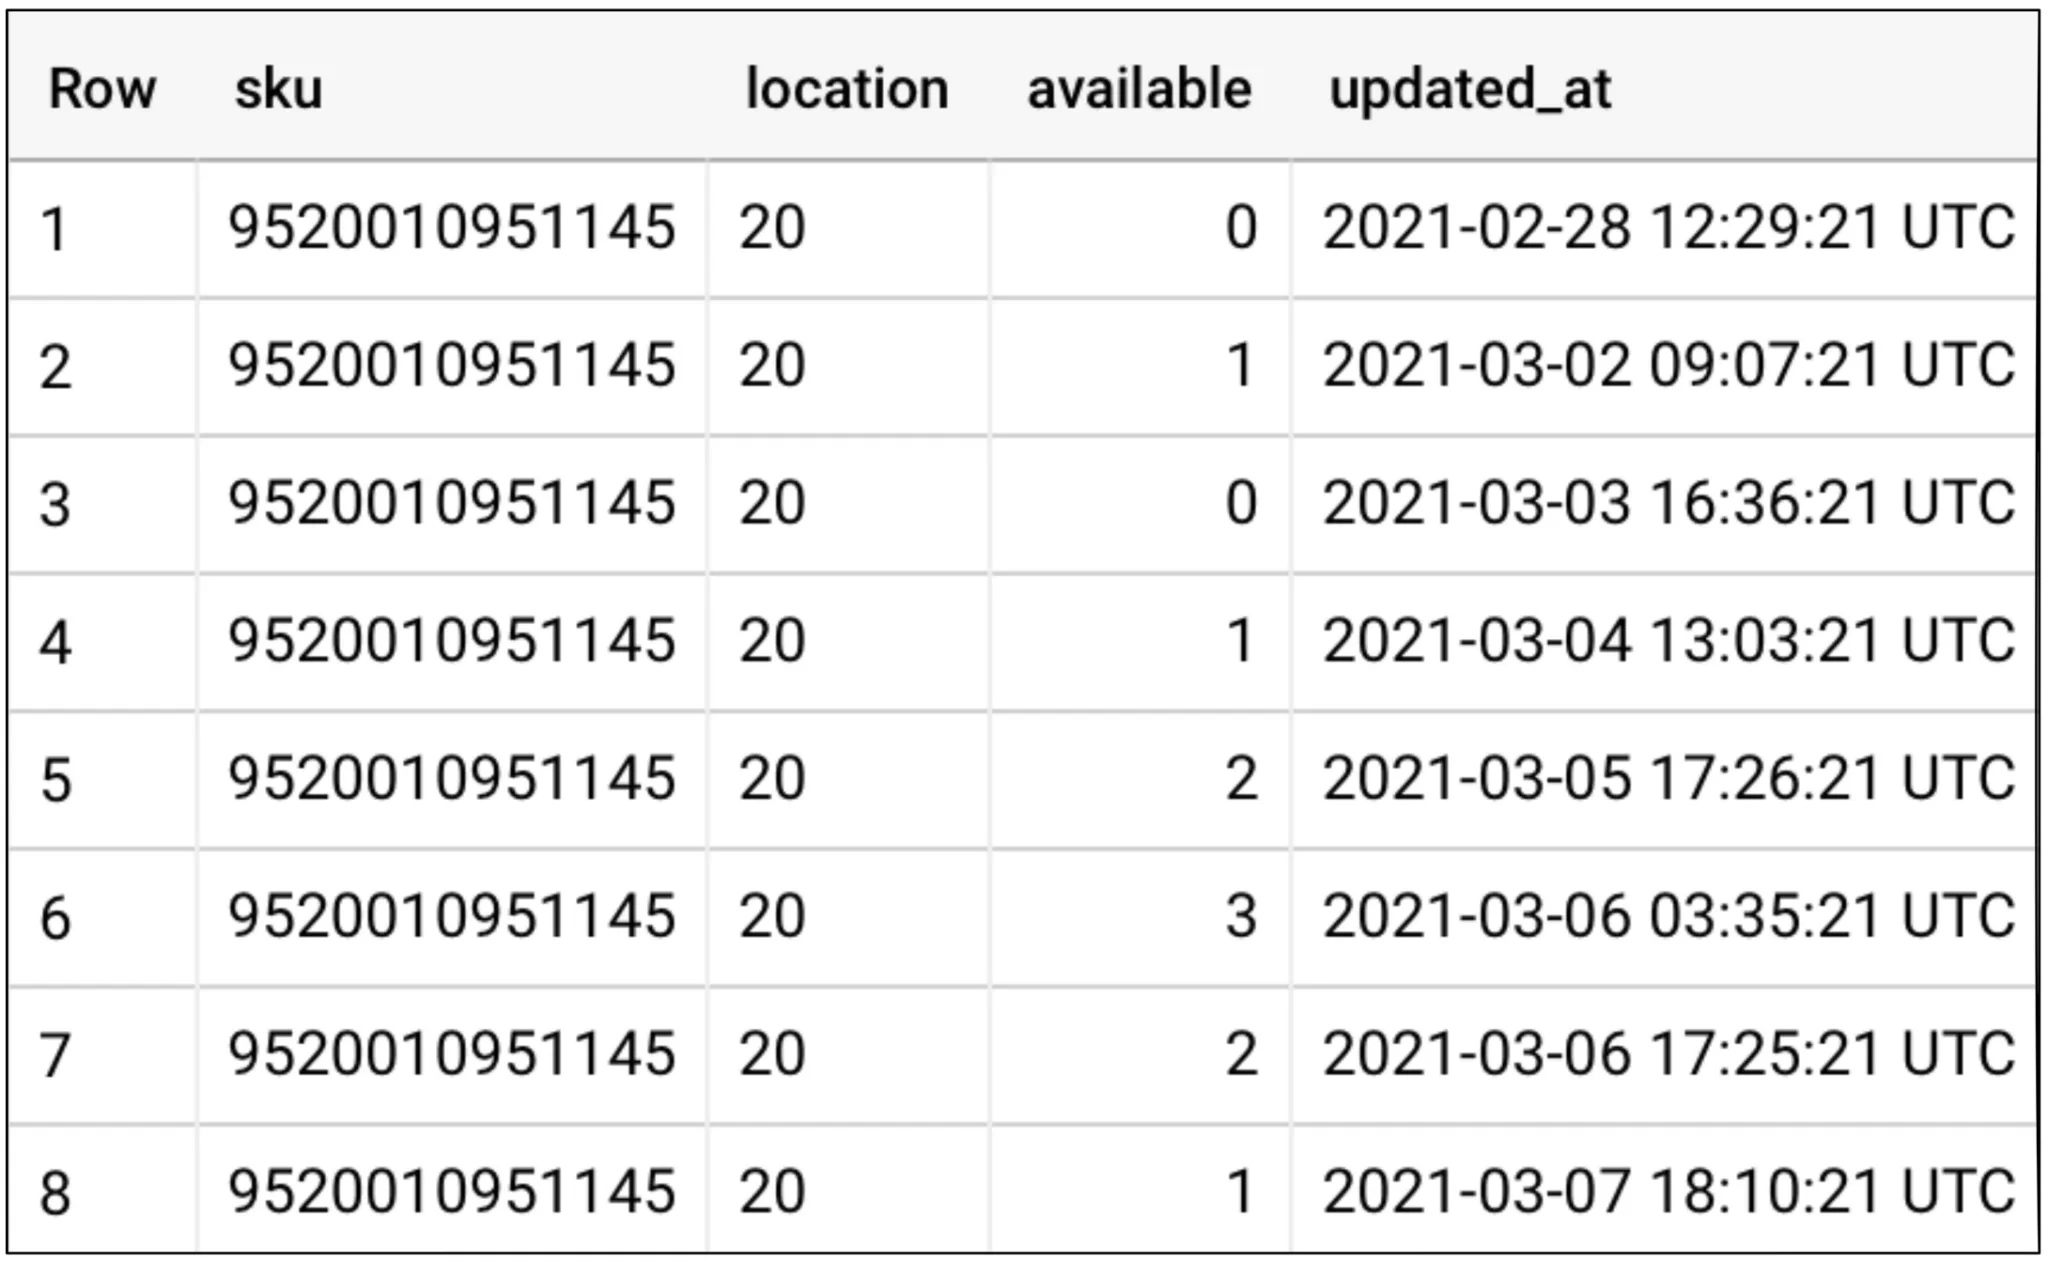
然后对数据进行清洗,例如作为原始数据的SQL查询。这些数据被创建为视图,如下所示的列表。去重并将JSON映射到各个字段。公共表表达式非常适合结构化。
WITH inventory_deduplicated AS (
   SELECT *
   EXCEPT (row_number)
   FROM (
            SELECT *,
                   ROW_NUMBER() OVER (PARTITION BY id ORDER BY time DESC) row_number
            FROM `datameshexample-fulfillment.raw.inventory`)
   WHERE row_number = 1
),
-- Step 2: Parse JSON to columns
inventory_parsed AS (
   SELECT
       json_value(data, "$.sku")                            AS sku,
       json_value(data, "$.location")                       AS location,
       CAST(json_value(data, "$.available") AS int64)      AS available,
       CAST(json_value(data, "$.updated_at") AS timestamp) AS updated_at,
   FROM inventory_deduplicated
)
-- Step 3: Actual Query
SELECT sku, location, available, updated_at
FROM inventory_parsed
ORDER BY sku, location, updated_at
清洗后的数据集为团队的内部数据分析提供了基础。通常需要区分不变的事件和随时间变化的主数据实体。使用SQL查询,团队现在可以分析这些数据。Jupyter Notebook通常用于建立和记录探索性发现。

推荐使用Jupyter Notebook进行探索性数据分析(图5)。
可视化有助于使数据更易于人们理解。数据平台应该为此提供适当的工具——图6以Google Data Studio为例。可视化的前提是访问表格或相应的查询。另一方面,数据的聚合也可以直接在工具中控制。

Google Data Studio条形图的示例(图6)
最后,数据也应该作为数据产品提供给其他团队。建议在这里使用视图,以确保即使底层数据集发生变化,数据的外部视图也保持一致。这样的迁移可以在视图的查询中进行跟踪。现在授予其他团队对此视图的权限,并通过SQL查询访问它。此外,必须根据约定的程序记录数据集。在最简单的情况下,可以在wiki或Git存储库中完成。然而,在更高级的发展阶段,应该使用提供有关数据集的元信息以及质量的数据目录,并精确记录各个字段(见图7)。

数据产品可以在数据目录中记录,例如(图7)
随着时间的推移,这将创建一个不同领域数据产品网格,可以在整个组织中使用。理想情况下,数据网格鼓励其他团队也使用提供的数据平台,并最终自己提供分析数据。
这里描述的方法对软件开发人员来说是实用的,因为可以使用SQL——大多数IT专家应该熟悉的工具。另一方面,数据的可视化处理以及统计方法可能需要重新学习。更复杂的数据准备工具,如Apache Spark、Apache Beam或NumPy,在最初阶段并不绝对必要。
数据网格作为新领域的创新驱动器
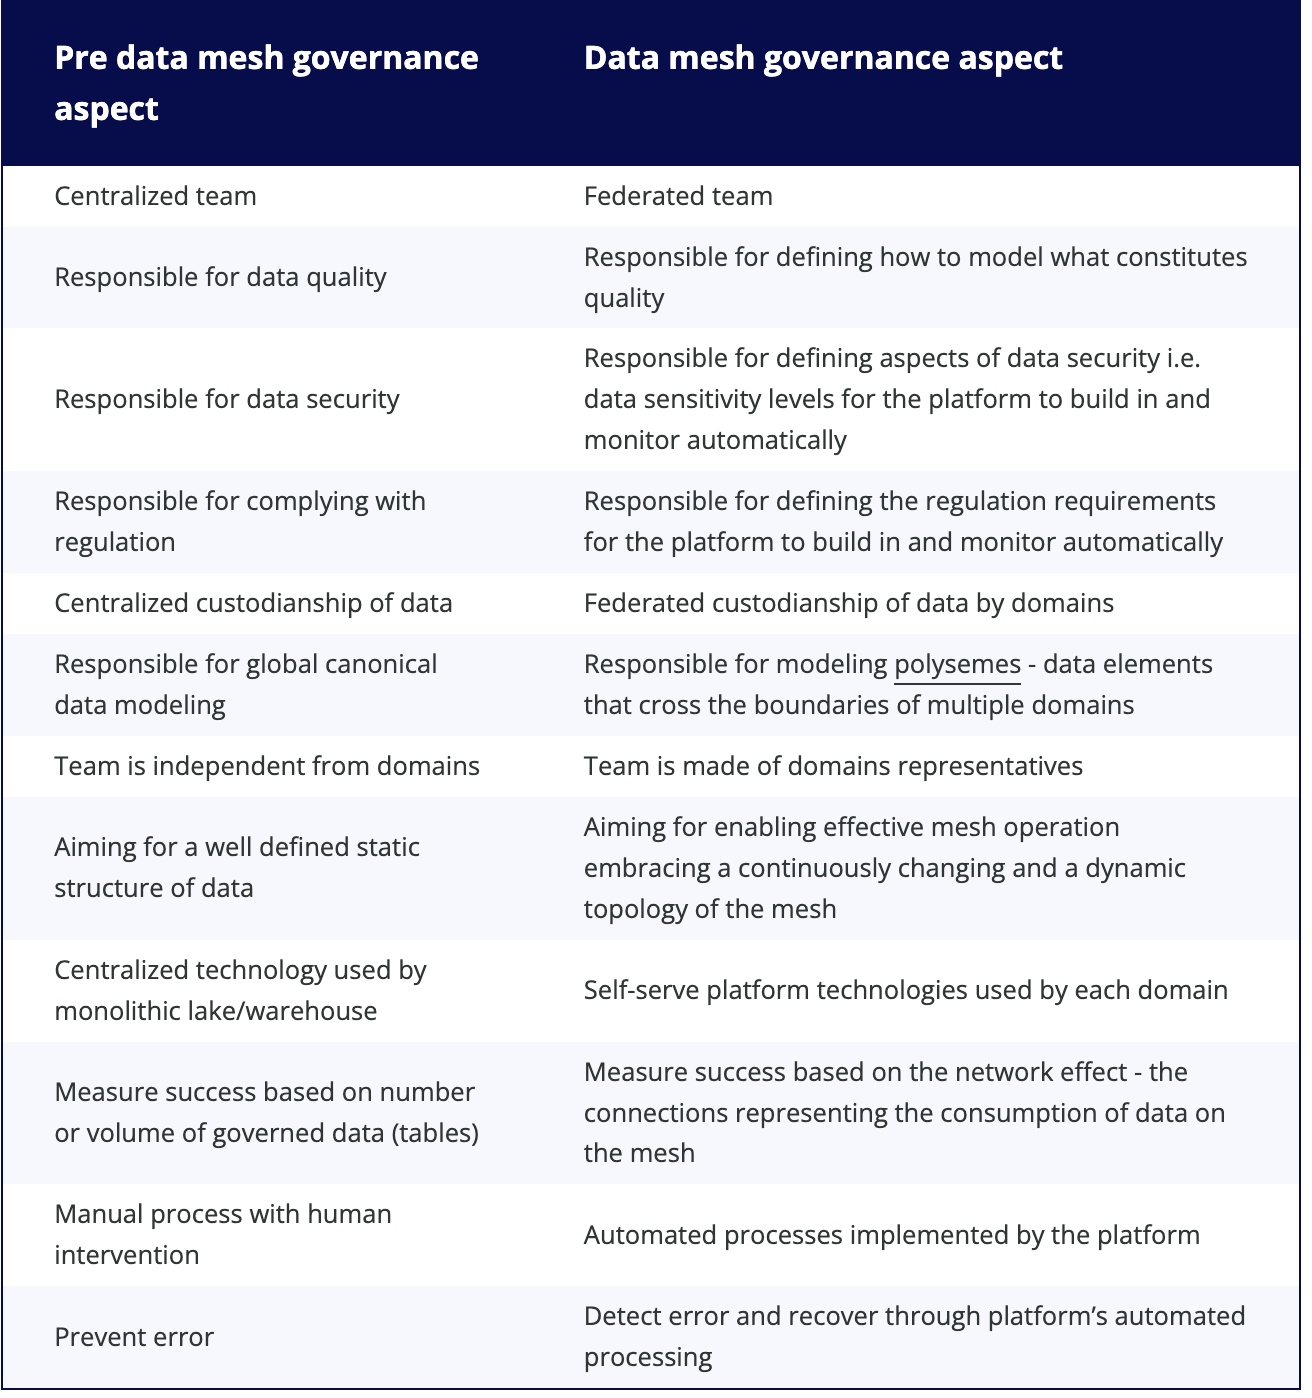
数据网格主要是关于领域团队能够自己进行数据分析。但是,在许多组织中已经存在的中央数据团队会发生什么变化呢?
由于其知识,数据团队注定要运营和管理上述数据平台,因为在使用自助云服务时仍需要设置权限并控制成本。该团队还可以作为使能者和大使,鼓励并帮助其他领域团队使用数据平台。通过为常见用例提供模板和最佳实践,他们使平台具有吸引力。专家还可以以顾问身份进入领域团队一段时间,以建立必要的技能。
必须继续提供现有的数据产品,例如用于企业管理的报告。这项任务最初仍然由现有的数据工程师承担。然而,他们的工作变得更加容易:如果领域团队以清晰约定的格式和一贯的高质量提供清洗后的数据集,那么繁琐的数据提取和准备步骤就被消除了。还应考虑为数据密集型领域建立单独的领域团队,例如用于企业管理或营销的团队。数据科学团队也可以为基于数据评估和机器学习模型的运营和分析服务提供客户画像或销售预测等专业领域,这些团队基于数据评估和机器学习模型提供运营和分析服务。
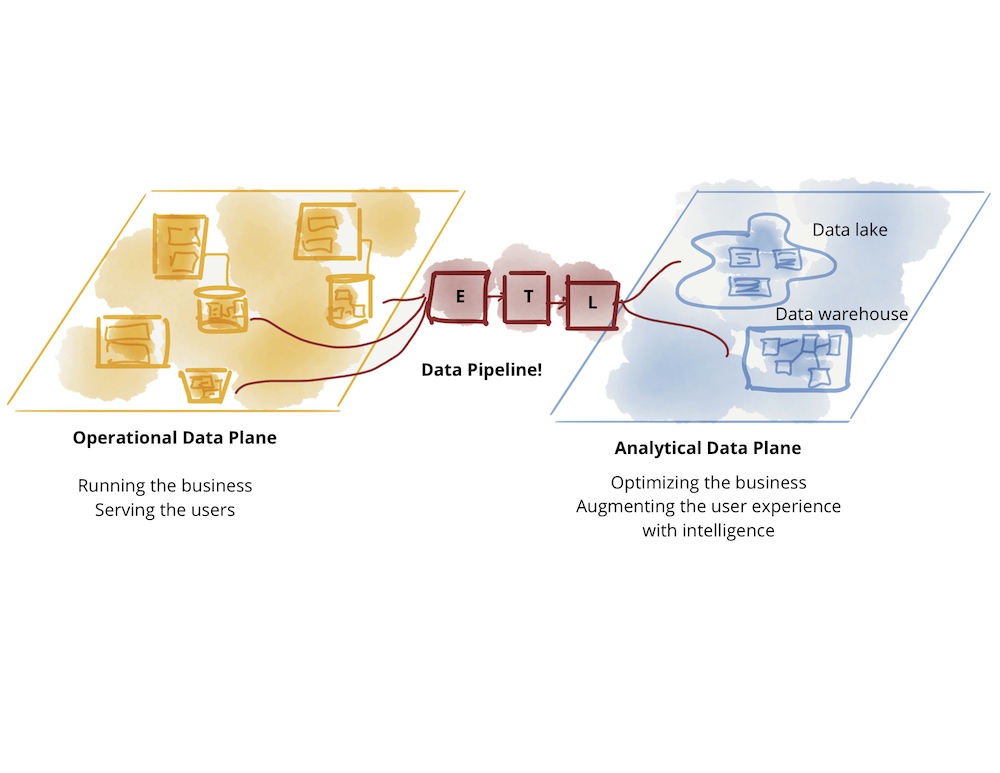 图1:数据的鸿沟
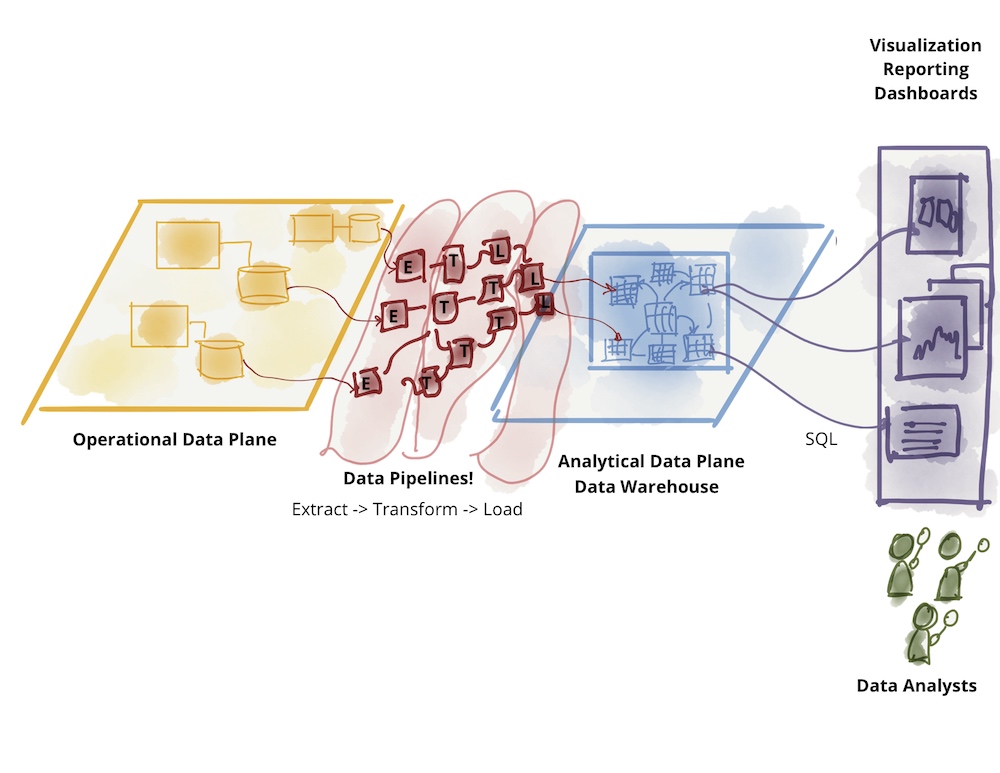
The C4 model for visualising software architecture 用于可视化软件架构的 C4 模型
The C4 model 定义
- A set of hierarchical abstractions (software systems, containers, components, and code).
翻译:一组分层抽象(软件系统、容器、组件和代码)。
- A set of hierarchical diagrams (system context, containers, components, and code).
翻译:一组分层图(系统上下文、容器、组件和代码)。
- Notation independent.
翻译:符号独立。
- Tooling independent.
翻译:工具独立。
Uses and benefits 用途和好处
The C4 model is an easy to learn, developer friendly approach to software architecture diagramming. Good software architecture diagrams assist with communication inside/outside of software development/product teams, efficient onboarding of new staff, architecture reviews/evaluations, risk identification (e.g. risk-storming), threat modelling, etc.
翻译: C4 模型是一种易于学习、开发人员友好的软件架构图绘制方法。良好的软件架构图有助于软件开发/产品团队内部/外部的沟通、新员工的高效入职、架构审查/评估、风险识别(例如风险风暴)、威胁建模等。
Introduction 介绍
Ask somebody in the building industry to visually communicate the architecture of a building and you'll be presented with site plans, floor plans, elevation views, cross-section views and detail drawings. In contrast, ask a software developer to communicate the software architecture of a software system using diagrams and you'll likely get a confused mess of boxes and lines ... inconsistent notation (colour coding, shapes, line styles, etc), ambiguous naming, unlabelled relationships, generic terminology, missing technology choices, mixed abstractions, etc.
翻译: 请建筑行业的某个人直观地传达建筑物的建筑结构,您将看到场地平面图、平面图、立面图、横截面图和详细图纸。相比之下,让软件开发人员使用图表来传达软件系统的软件架构,您可能会得到一堆混乱的方框和线条......不一致的符号(颜色编码、形状、线条样式等)、模棱两可的命名、未标记的关系、通用术语、缺少技术选择、混合抽象等。
As an industry, we do have the Unified Modeling Language (UML), ArchiMate and SysML, but asking whether these provide an effective way to communicate software architecture is often irrelevant because many teams have already thrown them out in favour of much simpler "boxes and lines" diagrams. Abandoning these modelling languages is one thing but, perhaps in the race for agility, many software development teams have lost the ability to communicate visually.
翻译: 作为一个行业,我们确实有统一建模语言(UML)、ArchiMate和SysML,但要问它们是否提供了一种有效的方法来传达软件架构通常是无关紧要的,因为许多团队已经抛弃了它们,转而使用更简单的“方框和线”图。放弃这些建模语言是一回事,但也许在敏捷性的竞赛中,许多软件开发团队已经失去了可视化通信的能力。
Maps of your code 代码映射
The C4 model was created as a way to help software development teams describe and communicate software architecture, both during up-front design sessions and when retrospectively documenting an existing codebase. It's a way to create maps of your code, at various levels of detail, in the same way you would use something like Google Maps to zoom in and out of an area you are interested in.
翻译: C4 模型的创建是为了帮助软件开发团队描述和交流软件架构,无论是在前期设计会议期间还是在回顾性地记录现有代码库时。这是一种在各种细节级别上创建代码地图的方法,就像你使用谷歌地图之类的东西来放大和缩小你感兴趣的区域一样。
The C4 model is an "abstraction-first" approach to diagramming software architecture, based upon abstractions that reflect how software architects and developers think about and build software. The small set of abstractions and diagram types makes the C4 model easy to learn and use. Please note that you don't need to use all 4 levels of diagram; only those that add value - the System Context and Container diagrams are sufficient for many software development teams.
翻译:C4 模型是一种“抽象优先”的软件架构图示方法,它基于反映软件架构师和开发人员如何思考和构建软件的抽象。一小部分抽象和图表类型使 C4 模型易于学习和使用。请注意,您不需要使用所有 4 个级别的图表;只有那些能增加价值的东西 - 系统上下文和容器图对于许多软件开发团队来说就足够了。
Different levels of zoom allow you to tell different stories to different audiences.
不同级别的缩放允许您向不同的受众讲述不同的故事。

Abstractions 抽象
In order to create these maps of your code, we first need a common set of abstractions to create a ubiquitous language that we can use to describe the static structure of a software system. A software system is made up of one or more containers (applications and data stores), each of which contains one or more components, which in turn are implemented by one or more code elements (classes, interfaces, objects, functions, etc). And people may use the software systems that we build.
翻译: 为了创建这些代码映射,我们首先需要一组通用的抽象来创建一种通用语言,我们可以用它来描述软件系统的静态结构。软件系统由一个或多个容器(应用程序和数据存储)组成,每个容器都包含一个或多个组件,而这些组件又由一个或多个代码元素(类、接口、对象、函数等)实现。人们可能会使用我们构建的软件系统。

Person 人
A person represents one of the human users of your software system (e.g. actors, roles, personas, etc).
翻译: 一个人代表您的软件系统的人类用户之一(例如演员、角色、角色等)。
Software System 软件系统
A software system is the highest level of abstraction and describes something that delivers value to its users, whether they are human or not. This includes the software system you are modelling, and the other software systems upon which your software system depends (or vice versa).
翻译: 软件系统是最高级别的抽象,它描述了为其用户提供价值的东西,无论他们是否是人类。这包括您正在建模的软件系统,以及您的软件系统所依赖的其他软件系统(反之亦然)。
Unfortunately the term "software system" is the hardest of the C4 model abstractions to define, and this isn't helped by the fact that each organisation will also have their own terminology for describing the same thing, typically using terms such as "application", "product", "service", etc. One way to think about it is that a software system is something a single software development team is building, owns, has responsibility for, and can see the internal implementation details of. Perhaps the code for that software system resides in a single source code repository, and anybody on the team is entitled to modify it. In many cases, the boundary of a software system will correspond to the boundary of a single team. It may also be the case that everything inside the boundary of a software system is deployed at the same time.
翻译: 不幸的是,“软件系统”这个术语是 C4 模型抽象中最难定义的,而且每个组织都有自己的术语来描述同一事物,通常使用“应用程序”、“产品”、“服务”等术语。一种思考方式是,软件系统是一个软件开发团队正在构建、拥有、负责并可以看到内部实现细节的东西。也许该软件系统的代码驻留在单个源代码存储库中,团队中的任何人都有权修改它。在许多情况下,软件系统的边界将对应于单个团队的边界。也可能是同时部署软件系统边界内的所有内容。
Container (applications and data stores) 容器(应用程序和数据存储)
Not Docker! In the C4 model, a container represents an application or a data store. A container is something that needs to be running in order for the overall software system to work. In real terms, a container is something like:
翻译: 不是Docker!在 C4 模型中,容器表示应用程序或数据存储。容器是整个软件系统工作所需要运行的东西。实际上,容器是这样的:
Server-side web application:
A Java EE web application running on Apache Tomcat, an ASP.NET MVC application running on Microsoft IIS, a Ruby on Rails application running on WEBrick, a Node.js application, etc.
翻译: 服务器端 Web 应用程序:运行在 Apache Tomcat 上的 Java EE Web 应用程序、运行在 Microsoft IIS 上的 ASP.NET MVC 应用程序、运行在 WEBrick 上的 Ruby on Rails 应用程序、Node.js 应用程序等。
Client-side web application:
A JavaScript application running in a web browser using Angular, Backbone.JS, jQuery, etc.
翻译: 客户端 Web 应用程序:使用 Angular、Backbone.JS、jQuery 等在 Web 浏览器中运行的 JavaScript 应用程序。
Client-side desktop application:
A Windows desktop application written using WPF, an OS X desktop application written using Objective-C, a cross-platform desktop application written using JavaFX, etc.
翻译: 客户端桌面应用程序:使用 WPF 编写的 Windows 桌面应用程序、使用 Objective-C 编写的 OS X 桌面应用程序、使用 JavaFX 编写的跨平台桌面应用程序等。
Mobile app:
An Apple iOS app, an Android app, a Microsoft Windows Phone app, etc.
翻译: 移动应用程序:Apple iOS 应用程序、Android 应用程序、Microsoft Windows Phone 应用程序等。
Server-side console application:
A standalone (e.g. "public static void main") application, a batch process, etc.
翻译: 服务器端控制台应用程序:独立(例如“public static void main”)应用程序、批处理等。
Serverless function:
A single serverless function (e.g. Amazon Lambda, Azure Function, etc).
翻译: 无服务器函数:单个无服务器函数(例如 Amazon Lambda、Azure 函数等)。
Database:
A schema or database in a relational database management system, document store, graph database, etc such as MySQL, Microsoft SQL Server, Oracle Database, MongoDB, Riak, Cassandra, Neo4j, etc.
翻译: 数据库:关系数据库管理系统、文档存储、图形数据库等中的模式或数据库,如MySQL、Microsoft SQL Server、Oracle Database、MongoDB、Riak、Cassandra、Neo4j等。
Blob or content store:
A blob store (e.g. Amazon S3, Microsoft Azure Blob Storage, etc) or content delivery network (e.g. Akamai, Amazon CloudFront, etc).
翻译: 对象或内容存储:对象存储(例如 Amazon S3、Microsoft Azure 对象存储等)或内容分发网络(例如 Akamai、Amazon CloudFront 等)。
File system:
A full local file system or a portion of a larger networked file system (e.g. SAN, NAS, etc).
翻译: 文件系统:完整的本地文件系统或较大的网络文件系统(例如 SAN、NAS 等)的一部分。
Shell script:
A single shell script written in Bash, etc.
翻译: Shell 脚本:用 Bash 等语言编写的单个 shell 脚本。
etc
Component 组件
The word "component" is a hugely overloaded term in the software development industry, but in this context a component is a grouping of related functionality encapsulated behind a well-defined interface. If you're using a language like Java or C#, the simplest way to think of a component is that it's a collection of implementation classes behind an interface. Aspects such as how those components are packaged (e.g. one component vs many components per JAR file, DLL, shared library, etc) is a separate and orthogonal concern.
翻译: “组件”这个词在软件开发行业中是一个非常过载的术语,但在这种情况下,组件是封装在定义良好的接口后面的一组相关功能。如果您使用的是 Java 或 C# 等语言,那么考虑组件的最简单方法是它是接口后面的实现类的集合。诸如如何打包这些组件(例如,一个组件与每个 JAR 文件、DLL、共享库等的多个组件)等方面是一个单独的正交问题。
An important point to note here is that all components inside a container typically execute in the same process space. In the C4 model, components are not separately deployable units.
翻译: 这里需要注意的重要一点是,容器内的所有组件通常在同一个进程空间中执行。在 C4 模型中,组件不是可单独部署的单元。
1. System Context diagram 系统上下文图


A System Context diagram is a good starting point for diagramming and documenting a software system, allowing you to step back and see the big picture. Draw a diagram showing your system as a box in the centre, surrounded by its users and the other systems that it interacts with.
翻译:系统上下文图是绘制和记录软件系统的良好起点,可让您退后一步,纵观全局。绘制一张图表,将您的系统显示为中间的一个框,周围环绕着其用户和与之交互的其他系统。
Detail isn't important here as this is your zoomed out view showing a big picture of the system landscape. The focus should be on people (actors, roles, personas, etc) and software systems rather than technologies, protocols and other low-level details. It's the sort of diagram that you could show to non-technical people.
翻译:细节在这里并不重要,因为这是您的缩小视图,显示了系统环境的大图。重点应该放在人(参与者、角色、角色等)和软件系统上,而不是技术、协议和其他低级细节上。这是您可以向非技术人员展示的那种图表。
Scope:
A single software system.
翻译:范围:单个软件系统。
Primary elements:
The software system in scope.
翻译:主要元素:范围内的软件系统。
Supporting elements:
People (e.g. users, actors, roles, or personas) and software systems (external dependencies) that are directly connected to the software system in scope. Typically these other software systems sit outside the scope or boundary of your own software system, and you don't have responsibility or ownership of them.
翻译:支持元素:直接连接到范围内软件系统的人员(例如用户、参与者、角色或角色)和软件系统(外部依赖关系)。通常,这些其他软件系统位于您自己的软件系统的范围或边界之外,您对它们没有责任或所有权。
Intended audience:
Everybody, both technical and non-technical people, inside and outside of the software development team.
翻译:目标受众:软件开发团队内部和外部的每个人,包括技术人员和非技术人员。
Recommended for most teams:
Yes.
翻译: 建议大多数团队:是的。
2. Container diagram 容器图


Once you understand how your system fits in to the overall IT environment, a really useful next step is to zoom-in to the system boundary with a Container diagram. A "container" is something like a server-side web application, single-page application, desktop application, mobile app, database schema, file system, etc. Essentially, a container is a separately runnable/deployable unit (e.g. a separate process space) that executes code or stores data.
翻译: 一旦您了解了系统如何适应整个 IT 环境,下一步就非常有用,就是使用容器图放大到系统边界。“容器”类似于服务器端 Web 应用程序、单页应用程序、桌面应用程序、移动应用程序、数据库架构、文件系统等。从本质上讲,容器是一个可单独运行/可部署的单元(例如,一个单独的进程空间),用于执行代码或存储数据。
The Container diagram shows the high-level shape of the software architecture and how responsibilities are distributed across it. It also shows the major technology choices and how the containers communicate with one another. It's a simple, high-level technology focussed diagram that is useful for software developers and support/operations staff alike.
翻译: 容器图显示了软件体系结构的高级形状以及如何在其中分配责任。它还显示了主要的技术选择以及容器之间的通信方式。这是一个以高级技术为重点的简单图表,对软件开发人员和支持/操作人员都很有用。
Scope:
A single software system.
翻译: 范围:单个软件系统。
Primary elements:
Containers within the software system in scope.
翻译:主要元素:范围内软件系统内的容器。
Supporting elements:
People and ### software systems directly connected to the containers.
翻译:支持元素:直接连接到容器的人员和软件系统。
Intended audience:
Technical people inside and outside of the software development team; including software architects, developers and operations/support staff.
翻译:目标受众:软件开发团队内外的技术人员;包括软件架构师、开发人员和运营/支持人员。
Recommended for most teams:
Yes.
翻译:建议大多数团队:是的。
Notes:
This diagram says nothing about clustering, load balancers, replication, failover, etc because it will likely vary across different environments (e.g. production, staging, development, etc). This information is better captured via one or more deployment diagrams.
翻译:注意:此图未提及群集、负载均衡器、复制、故障转移等,因为它可能因不同环境(例如生产、暂存、开发等)而异。通过一个或多个部署关系图可以更好地捕获此信息。
3. Component diagram 组件图


Next you can zoom in and decompose each container further to identify the major structural building blocks and their interactions.
翻译:接下来,您可以进一步放大和分解每个容器,以识别主要的结构构建块及其交互。
The Component diagram shows how a container is made up of a number of "components", what each of those components are, their responsibilities and the technology/implementation details.
翻译:组件图显示了容器如何由许多“组件”组成,每个组件是什么,它们的职责以及技术/实现详细信息。
Scope:
A single container.
翻译:作用域:单个容器。
Primary elements:
Components within the container in scope.
翻译:主要元素:容器范围内的组件。
Supporting elements:
Containers (within the software system in scope) plus people and software systems directly connected to the components.
翻译: 支持元素:容器(在软件系统范围内)以及直接连接到组件的人员和软件系统。
Intended audience:
Software architects and developers.
翻译:目标受众:软件架构师和开发人员。
Recommended for most teams:
No, only create component diagrams if you feel they add value, and consider automating their creation for long-lived documentation.
翻译:建议大多数团队:不可以,只有在您认为组件图可以增加价值时才创建组件图,并考虑自动创建它们以获得长期文档。
4. Code diagram 代码图

Finally, you can zoom in to each component to show how it is implemented as code; using UML class diagrams, entity relationship diagrams or similar.
翻译:最后,您可以放大每个组件以显示它如何作为代码实现;使用 UML 类图、实体关系图或类似工具。
This is an optional level of detail and is often available on-demand from tooling such as IDEs. Ideally this diagram would be automatically generated using tooling (e.g. an IDE or UML modelling tool), and you should consider showing only those attributes and methods that allow you to tell the story that you want to tell. This level of detail is not recommended for anything but the most important or complex components.
翻译:这是一个可选的细节级别,通常可从 IDE 等工具中按需获得。理想情况下,此图将使用工具(例如 IDE 或 UML 建模工具)自动生成,并且您应该考虑仅显示那些允许您讲述要讲述的故事的属性和方法。除了最重要或最复杂的组件外,不建议对任何组件使用此级别的详细信息。
Scope:
A single component.
翻译:作用域:单个组件。
Primary elements:
Code elements (e.g. classes, interfaces, objects, functions, database tables, etc) within the component in scope.
翻译:主要元素:作用域内组件中的代码元素(例如类、接口、对象、函数、数据库表等)。
Intended audience:
Software architects and developers.
翻译:目标受众:软件架构师和开发人员。
Recommended for most teams:
No, particularly for long-lived documentation because most IDEs can generate this level of detail on demand.
翻译:建议大多数团队使用:否,特别是对于长期文档,因为大多数 IDE 都可以按需生成此级别的详细信息。
System Landscape diagram 系统

The C4 model provides a static view of a single software system but, in the real-world, software systems never live in isolation. For this reason, and particularly if you are responsible for a collection/portfolio of software systems, it's often useful to understand how all of these software systems fit together within a given enterprise, organisation, department, etc. Essentially this is a map of the software systems within the chosen scope, with a C4 drill-down for each software system of interest.
翻译:C4 模型提供了单个软件系统的静态视图,但在现实世界中,软件系统从来都不是孤立存在的。出于这个原因,特别是如果您负责软件系统的集合/组合,了解所有这些软件系统如何在给定的企业、组织、部门等中组合在一起通常很有用。从本质上讲,这是所选范围内软件系统的映射,每个感兴趣的软件系统都有 C4 向下钻取。
From a practical perspective, a system landscape diagram is really just a system context diagram without a specific focus on a particular software system.
翻译:从实践的角度来看,系统景观图实际上只是一个系统上下文图,没有特别关注特定的软件系统。
Scope:
An enterprise/organisation/department/etc.
翻译:范围:企业/组织/部门/等。
Primary elements:
People and software systems related to the chosen scope.
翻译:主要元素:与所选范围相关的人员和软件系统。
Intended audience:
Technical and non-technical people, inside and outside of the software development team.
翻译:目标受众:软件开发团队内部和外部的技术人员和非技术人员。
Dynamic diagram 动态图

A dynamic diagram can be useful when you want to show how elements in the static model collaborate at runtime to implement a user story, use case, feature, etc. This dynamic diagram is based upon a UML communication diagram (previously known as a "UML collaboration diagram"). It is similar to a UML sequence diagram although it allows a free-form arrangement of diagram elements with numbered interactions to indicate ordering.
翻译:当您想要显示静态模型中的元素如何在运行时协作以实现用户故事、用例、功能等时,动态图可能很有用。此动态图基于 UML 通信图(以前称为“UML 协作图”)。它类似于 UML 序列图,尽管它允许图元素的自由格式排列,并带有编号的交互来指示排序。
Scope:
A particular feature, story, use case, etc.
翻译:范围:特定功能、故事、用例等。
Primary and supporting elements:
Your choice - you can show software systems, containers, or components interacting at runtime.
翻译:主要元素和支持元素:您的选择 - 您可以显示软件系统、容器或组件在运行时进行交互。
Intended audience:
Technical and non-technical people, inside and outside of the software development team.
翻译:目标受众:软件开发团队内部和外部的技术人员和非技术人员。
Notes:
Feel free to use a UML sequence diagram if you prefer that visual style.
翻译:注意:如果您喜欢这种视觉样式,请随意使用 UML 序列图。
Deployment diagram 部署图


A deployment diagram allows you to illustrate how instances of software systems and/or containers in the static model are deployed on to the infrastructure within a given deployment environment (e.g. production, staging, development, etc). It's based upon a UML deployment diagram.
翻译:部署图允许您说明静态模型中的软件系统和/或容器实例如何部署到给定部署环境(例如生产、暂存、开发等)中的基础架构上。它基于 UML 部署图。
A deployment node represents where an instance of a software system/container is running; perhaps physical infrastructure (e.g. a physical server or device), virtualised infrastructure (e.g. IaaS, PaaS, a virtual machine), containerised infrastructure (e.g. a Docker container), an execution environment (e.g. a database server, Java EE web/application server, Microsoft IIS), etc. Deployment nodes can be nested.
翻译:部署节点表示软件系统/容器实例的运行位置;也许是物理基础设施(例如物理服务器或设备),虚拟化基础设施(例如IaaS,PaaS,虚拟机),容器化基础设施(例如Docker容器),执行环境(例如数据库服务器,Java EE Web/应用程序服务器,Microsoft IIS)等。部署节点可以嵌套。
You may also want to include infrastructure nodes such as DNS services, load balancers, firewalls, etc.
翻译:您可能还希望包括基础架构节点,例如 DNS 服务、负载均衡器、防火墙等。
Feel free to use icons provided by Amazon Web Services, Azure, etc to complement your deployment diagrams ... just make sure any icons you use are included in your diagram key/legend.
翻译:随意使用 Amazon Web Services、Azure 等提供的图标来补充您的部署图......只需确保您使用的任何图标都包含在图表键/图例中即可。
Scope:
One or more software systems within a single deployment environment (e.g. production, staging, development, etc).
翻译:范围:单个部署环境中的一个或多个软件系统(例如生产、暂存、开发等)。
Primary elements:
Deployment nodes, software system instances, and container instances.
翻译:主要元素:部署节点、软件系统实例和容器实例。
Supporting elements:
Infrastructure nodes used in the deployment of the software system.
翻译:支持元素:用于部署软件系统的基础架构节点。
Intended audience:
Technical people inside and outside of the software development team; including software architects, developers, infrastructure architects, and operations/support staff.
翻译:目标受众:软件开发团队内外的技术人员;包括软件架构师、开发人员、基础架构架构师和运营/支持人员。
Notation 表示法
The C4 model is notation independent, and doesn't prescribe any particular notation. As a starting point though, a simple notation that works well on whiteboards, paper, sticky notes, index cards and a variety of diagraming tools is as follows.
翻译:C4 模型与符号无关,不规定任何特定的符号。不过,作为起点,一个简单的符号在白板、纸张、便笺、索引卡和各种图表工具上都适用,如下所示。

You can then use colour and shapes to supplement the diagram, either to add additional information or simply to make the diagram more aesthetically pleasing.
翻译:然后,您可以使用颜色和形状来补充图表,以添加其他信息或只是使图表更美观。
C4 and UML /C4 和 UML
Although the example diagrams above are created using a "boxes and lines" notation, the core diagrams can be illustrated using UML with the appropriate use of packages, components and stereotypes. The resulting UML diagrams do tend to lack the same degree of descriptive text though, because adding such text isn't possible (or easy) with some UML tools.
翻译:尽管上面的示例图是使用“框和线”表示法创建的,但可以使用 UML 并适当使用包、组件和构造型来说明核心图。但是,生成的 UML 图确实往往缺乏相同程度的描述性文本,因为使用某些 UML 工具无法(或轻松)添加此类文本。
Here are three examples of a System Context, Container and Component diagram for comparison.
翻译:以下是系统上下文、容器和组件图的三个示例,以供比较。


C4 and ArchiMate C4 和 ArchiMate
See C4 Model, Architecture Viewpoint and Archi 4.7 for details of how to create C4 model diagrams with ArchiMate.
翻译:请参阅 C4 模型、架构视点 和 Archi 4.7,了解如何使用 ArchiMate 创建 C4 模型图的详细信息。
Diagram key/legend 图表键/图例
Any notation used should be as self-describing as possible, but all diagrams should have a key/legend to make the notation explicit. This applies to diagrams created with notations such as UML, ArchiMate and SysML too, as not everybody will know the notation being used.
翻译:使用的任何符号都应尽可能自我描述,但所有图表都应具有键/图例以使符号显式。这也适用于使用 UML、ArchiMate 和 SysML 等符号创建的图表,因为不是每个人都知道所使用的符号。
Notation, notation, notation 符号,符号,符号
Although the C4 model is an abstraction-first approach and notation independent, you still need to ensure that your diagram notation makes sense, and that the diagrams are comprehensible. A good way to think about this is to ask yourself whether each diagram can stand alone, and be (mostly) understood without a narrative. You can use this short software architecture diagram review checklist to help. And here are some recommendations related to notation.
翻译:尽管 C4 模型是一种抽象优先的方法,并且与符号无关,但您仍然需要确保图表符号有意义,并且图表是可理解的。思考这个问题的一个好方法是问问自己,每个图表是否可以独立存在,并且(大部分)在没有叙述的情况下被理解。您可以使用这个简短的软件架构图审查清单来提供帮助。这里有一些与符号相关的建议。
Diagrams 图
Every diagram should have a title describing the diagram type and scope (e.g. "System Context diagram for My Software System").
翻译:每个图表都应该有一个描述图表类型和范围的标题(例如,“我的软件系统的系统上下文图”)。
Every diagram should have a key/legend explaining the notation being used (e.g. shapes, colours, border styles, line types, arrow heads, etc).
翻译:每个图表都应该有一个键/图例来解释所使用的符号(例如形状、颜色、边框样式、线条类型、箭头等)。
Acronyms and abbreviations (business/domain or technology) should be understandable by all audiences, or explained in the diagram key/legend.
翻译:首字母缩略词和缩写词(业务/领域或技术)应为所有受众所理解,或在图表键/图例中解释。
Elements 元素
The type of every element should be explicitly specified (e.g. Person, Software System, Container or Component).
翻译:应明确指定每个元素的类型(例如,人员、软件系统、容器或组件)。
Every element should have a short description, to provide an "at a glance" view of key responsibilities.
翻译:每个元素都应该有一个简短的描述,以提供关键职责的“一目了然”视图。
Every container and component should have a technology explicitly specified.
翻译:每个容器和组件都应具有明确指定的技术。
Relationships 关系
Every line should represent a unidirectional relationship.
翻译:每条线都应该表示一个单向关系。
Every line should be labelled, the label being consistent with the direction and intent of the relationship (e.g. dependency or data flow). Try to be as specific as possible with the label, ideally avoiding single words like, "Uses".
翻译:每一行都应该被标记,标签与关系的方向和意图一致(例如依赖关系或数据流)。尽量使标签更具体,最好避免使用“用途”等单个词。
Relationships between containers (typically these represent inter-process communication) should have a technology/protocol explicitly labelled.
翻译:容器之间的关系(通常表示进程间通信)应具有显式标记的技术/协议。
Alternative visualisations 替代可视化
Finally, don't feel that you need to always use a traditional "boxes and arrows" diagram. Although this is usually the default approach, there are other, often interactive, visualisations that can be used to show the same C4 model abstractions in very different ways.
翻译: 最后,不要觉得你需要总是使用传统的“方框和箭头”图。虽然这通常是默认方法,但还有其他(通常是交互式的)可视化可用于以非常不同的方式显示相同的 C4 模型抽象。
- Traditional "boxes and arrows" diagrams are the default approach for documentation and presentations.
翻译:传统的“方框和箭头”图是文档和演示文稿的默认方法。
- A D3.js force-directed graph is a very concise way to visualise larger software architectures, also providing an easy way to explore dependencies.
翻译:D3.js力导向图是可视化大型软件架构的一种非常简洁的方法,也提供了一种探索依赖关系的简单方法。
- Ilograph's interactive diagrams provide a way to selectively zoom in and out, allowing you to explore your entire software architecture model.
翻译:Ilograph 的交互式图表提供了一种有选择地放大和缩小的方法,允许您探索整个软件架构模型。
Tooling 工具
For design sessions, you might find a whiteboard or flip chart paper better for collaboration, and iterating quickly. For long-lived documentation, there are a number of tools can help create software architecture diagrams based upon the C4 model.
翻译:对于设计会议,您可能会发现白板或活动挂图纸更适合协作,并且可以快速迭代。对于长期文档,有许多工具可以帮助创建基于 C4 模型的软件架构图。
Don't forget to ask yourself some questions when looking at tooling, to understand the features you need. Who are the diagram authors, and how technical are they? A "drag and drop" UI vs "diagrams as code"? Data stored in git next to your source code vs stored in the tool/cloud service? Closed vs open data format? Interactive vs static diagrams? Free vs paid vs open source? Short-lived vs long-lived documentation? Team only diagramming vs enterprise-wide modelling? Who is the diagram audience, and how would they access the diagrams/documentation?
翻译:在查看工具时,不要忘记问自己一些问题,以了解您需要的功能。谁是图表作者,他们的技术水平如何?“拖放式”UI与“图表即代码”?存储在源代码旁边的 git 中的数据与存储在工具/云服务中的数据?封闭式数据格式与开放式数据格式?交互式图表与静态图表?免费 vs 付费 vs 开源?短期文档与长期文档?仅团队图表与企业范围的建模?谁是图表受众,他们将如何访问图表/文档?
Copyright © 2015 Powered by MWeb, Theme used GitHub CSS.